This project focused on optimizing race selection and performance prediction for collegiate cross-country athletes through a data-driven platform. We collected and cleaned large-scale data from the LACCTIC API, processing over 103,000 runners, 9,000 races, and nearly 750,000 results using automated Postman pipelines. Structured datasets (TEAMS, RUNNERS, RACES, RESULTS) enabled feature engineering of runner ability metrics, race importance, and environmental conditions such as weather and altitude.
On the machine learning side, we benchmarked multiple regression models—Linear, Ridge, LightGBM, CatBoost, and XGBoost—for predicting athlete placements. Initial trials with linear models plateaued at ~71% variance explained, but incorporating race-level metrics, weather features, and runner ability improved results dramatically. XGBoost emerged as the best performer, achieving a 94% R², demonstrating strong predictive power across diverse race scenarios.
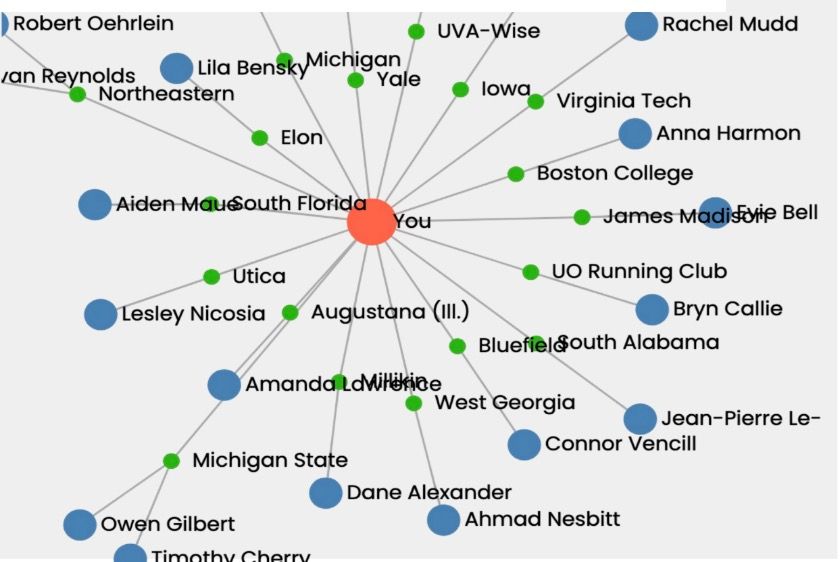
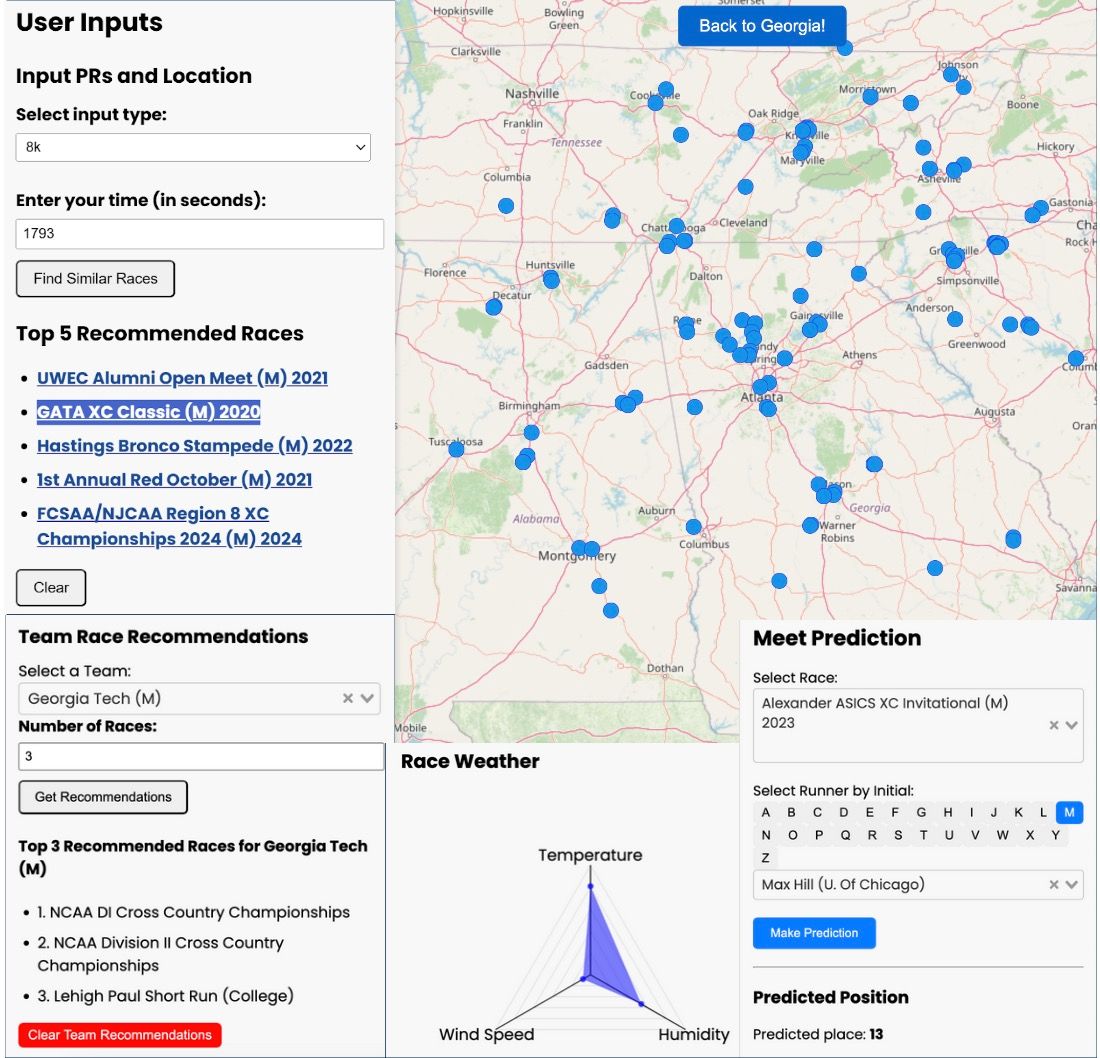
For recommendations, we implemented both individual and team-based systems. Individual recommendations used normalized times to identify races where an athlete’s performance would align with competitive cohorts. Team recommendations leveraged collaborative filtering based on Jaccard similarity across race participation histories, suggesting meets attended by similar teams but not by the target team. These approaches ensured recommendations balanced geographic feasibility, competitiveness, and logistical considerations.
The tool’s frontend was built in Vue.js with Nuxt, integrating Leaflet.js for interactive maps and D3.js for dynamic visualizations. Coaches and athletes could explore a U.S. map of meets, view personalized recommendations, compare similar runners, and visualize predicted placements alongside contextual factors like weather and race size. This transformed a traditionally manual, intuition-based process into a scalable and data-driven decision aid.
Overall, the system demonstrated how combining large-scale sports data with machine learning and geospatial visualization can enhance strategy and planning in collegiate athletics, offering insights that were previously inaccessible without significant manual effort.